Analytics
While Backoffice provides real-time information for daily operations, the analytics dashboard provides deeper insights from long-term historical data. A collection of key performance indicators (KPIs), graphs, and tables helps better understand and optimize company processes.
The analytics section is currently available only in English. To create custom dashboards or analyses, the public event export can be used to integrate raw data into a custom data warehouse.
The dashboard displays data up to the previous day and is updated once a night. This applies not only to the display of new data, but also to changes to master data, for example, names of facilities. The system uses a configured time zone to assign events to a specific date. Currently, only a single time zone can be used.
Content and navigation
Opening the analytics area displays the overview page, which also contains the navigation menu. The dashboard is organized by domain, and each domain can contain multiple subpages. Each of these pages addresses a topic such as Orders or Routing. The column on the far left contains cross-domain pages.

Most pages offer filters to select a time period or a specific facility, for example. In some cases, the time granularity can also be selected (daily, weekly, or monthly). The system applies filters and settings only where they are applicable. For example, it is not possible to filter unroutable orders by facility, because no facility is assigned to them yet.
The company and country filters are also facility filters that use the most recent assignment in the facility's master data. This means that if a facility's company is changed, the change is reflected for all historical data in the dashboard, not just for future data.
The availability of individual pages and filter options depends on the tenant configuration.

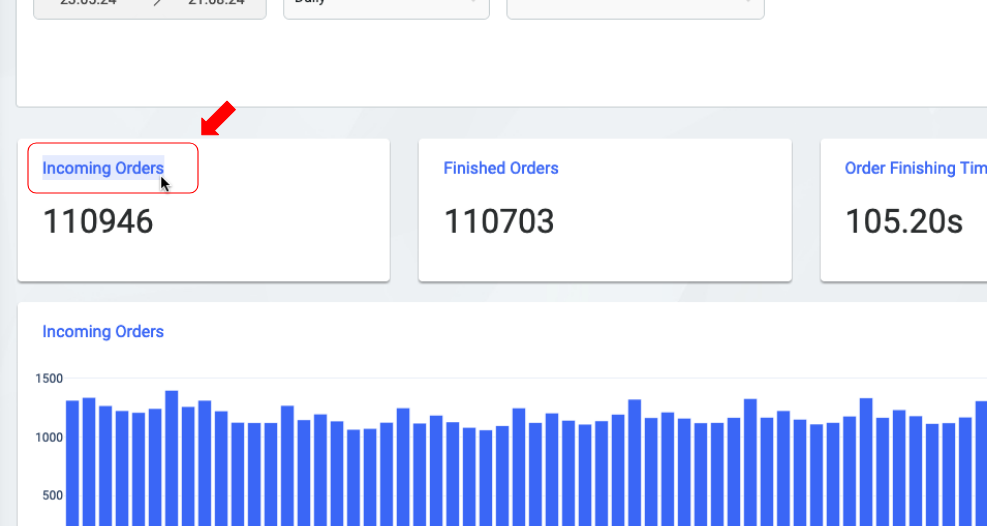
The dashboard content is organized in a grid of tiles. Each tile can contain a chart, a table, or a single number. Clicking the heading of a tile, such as Incoming Orders, opens the corresponding section in this documentation.

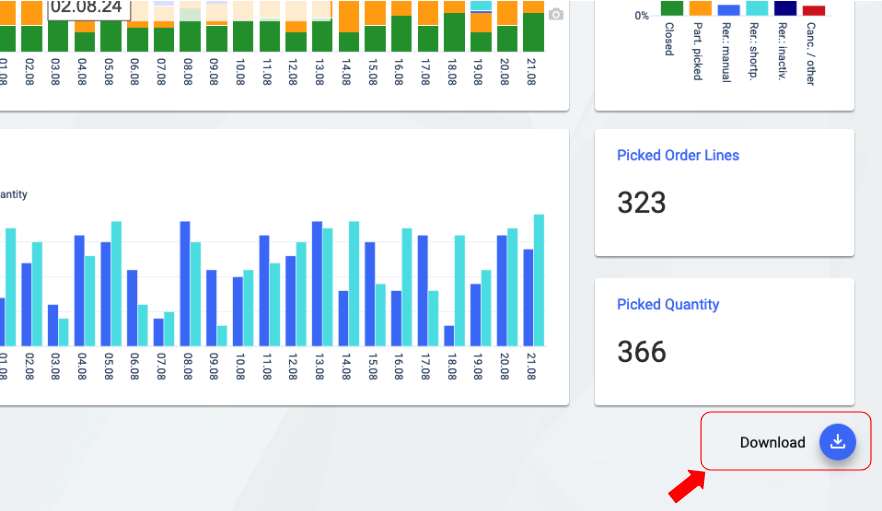
At the bottom right of most pages, a button is available to download the displayed data as an Excel file. The download takes the current filter settings into account.

Dashboard pages
Overview page
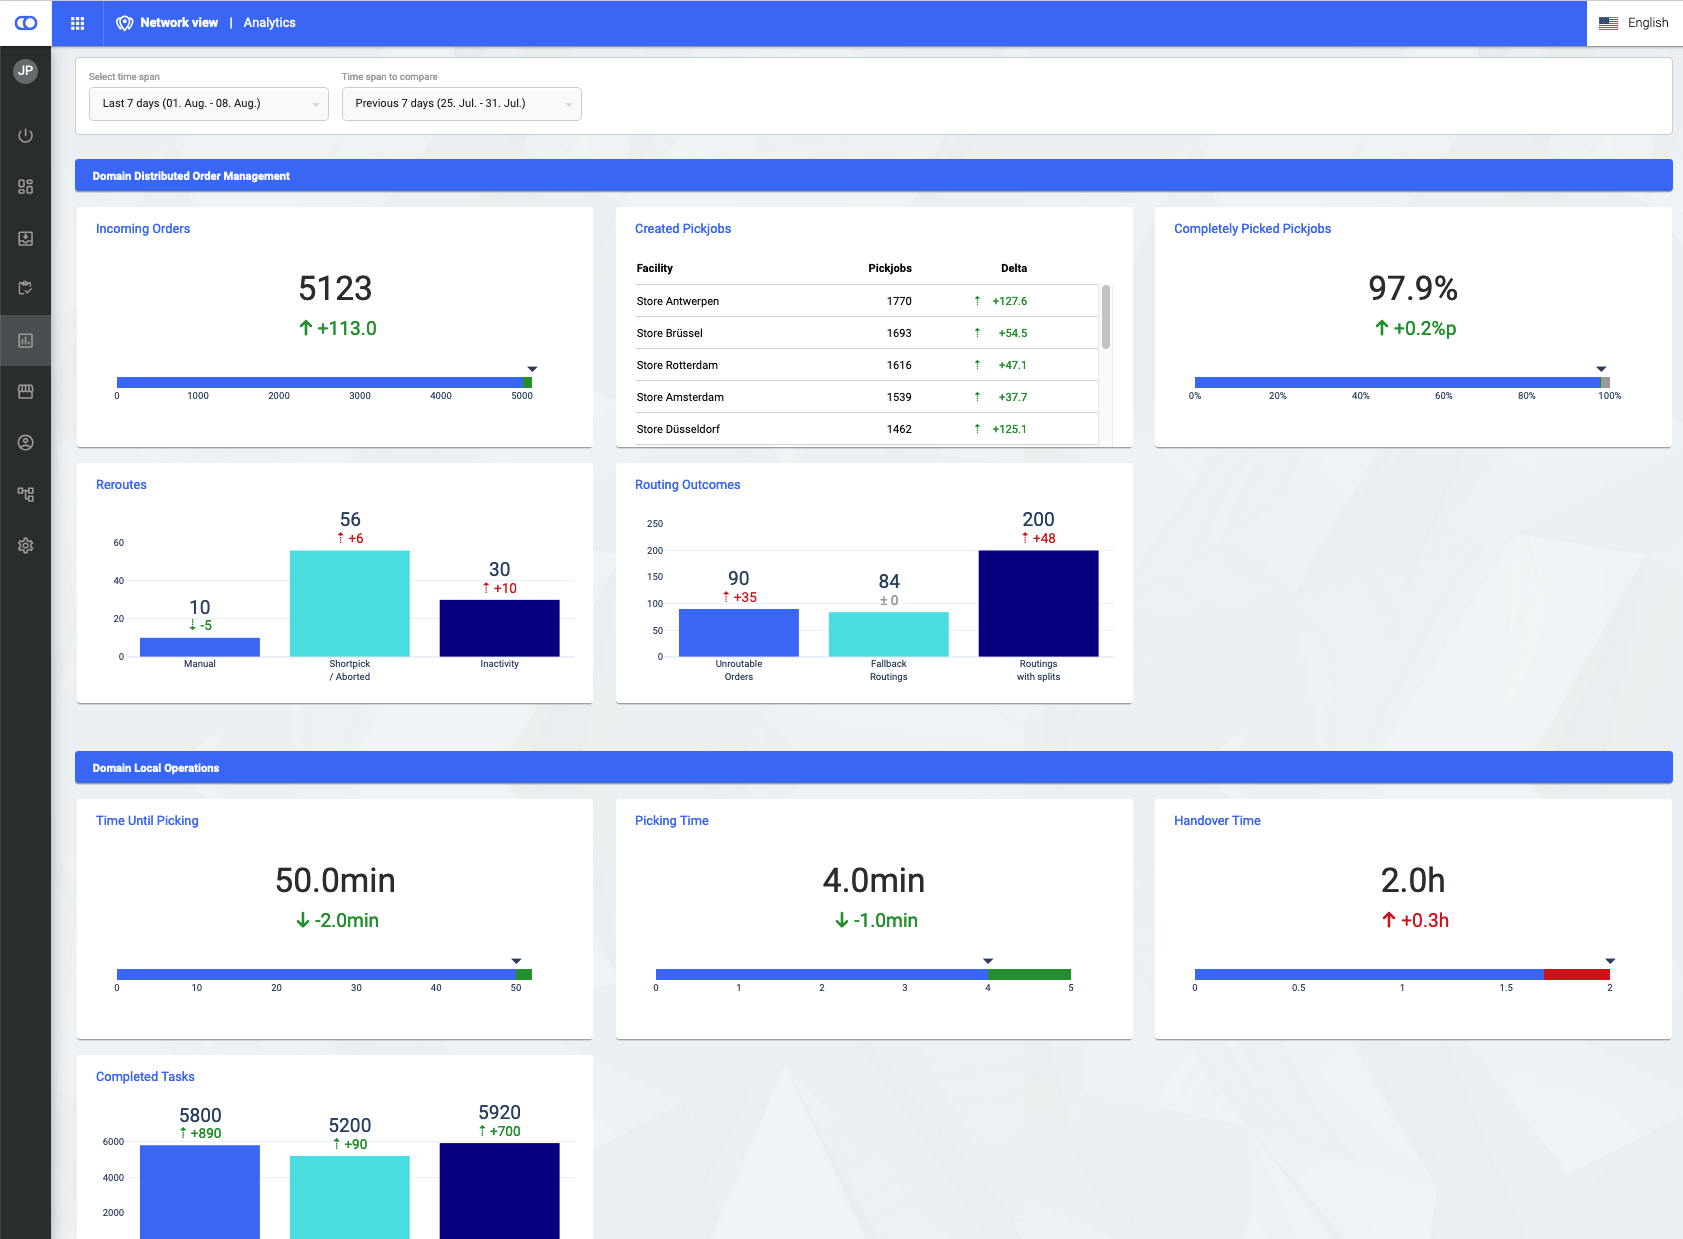
The overview page provides a high-level summary of key figures from different domains. A dropdown menu allows for selecting a time period and a comparison period. For example, users can view incoming orders for the current month and compare them with the previous month.
All data on this page is also available in greater detail on the respective subpages, where the time period can be selected freely.

Subpages
Descriptions of the individual subpages are available at the following links:
Last updated

