DOMS pages
Last updated
Last updated
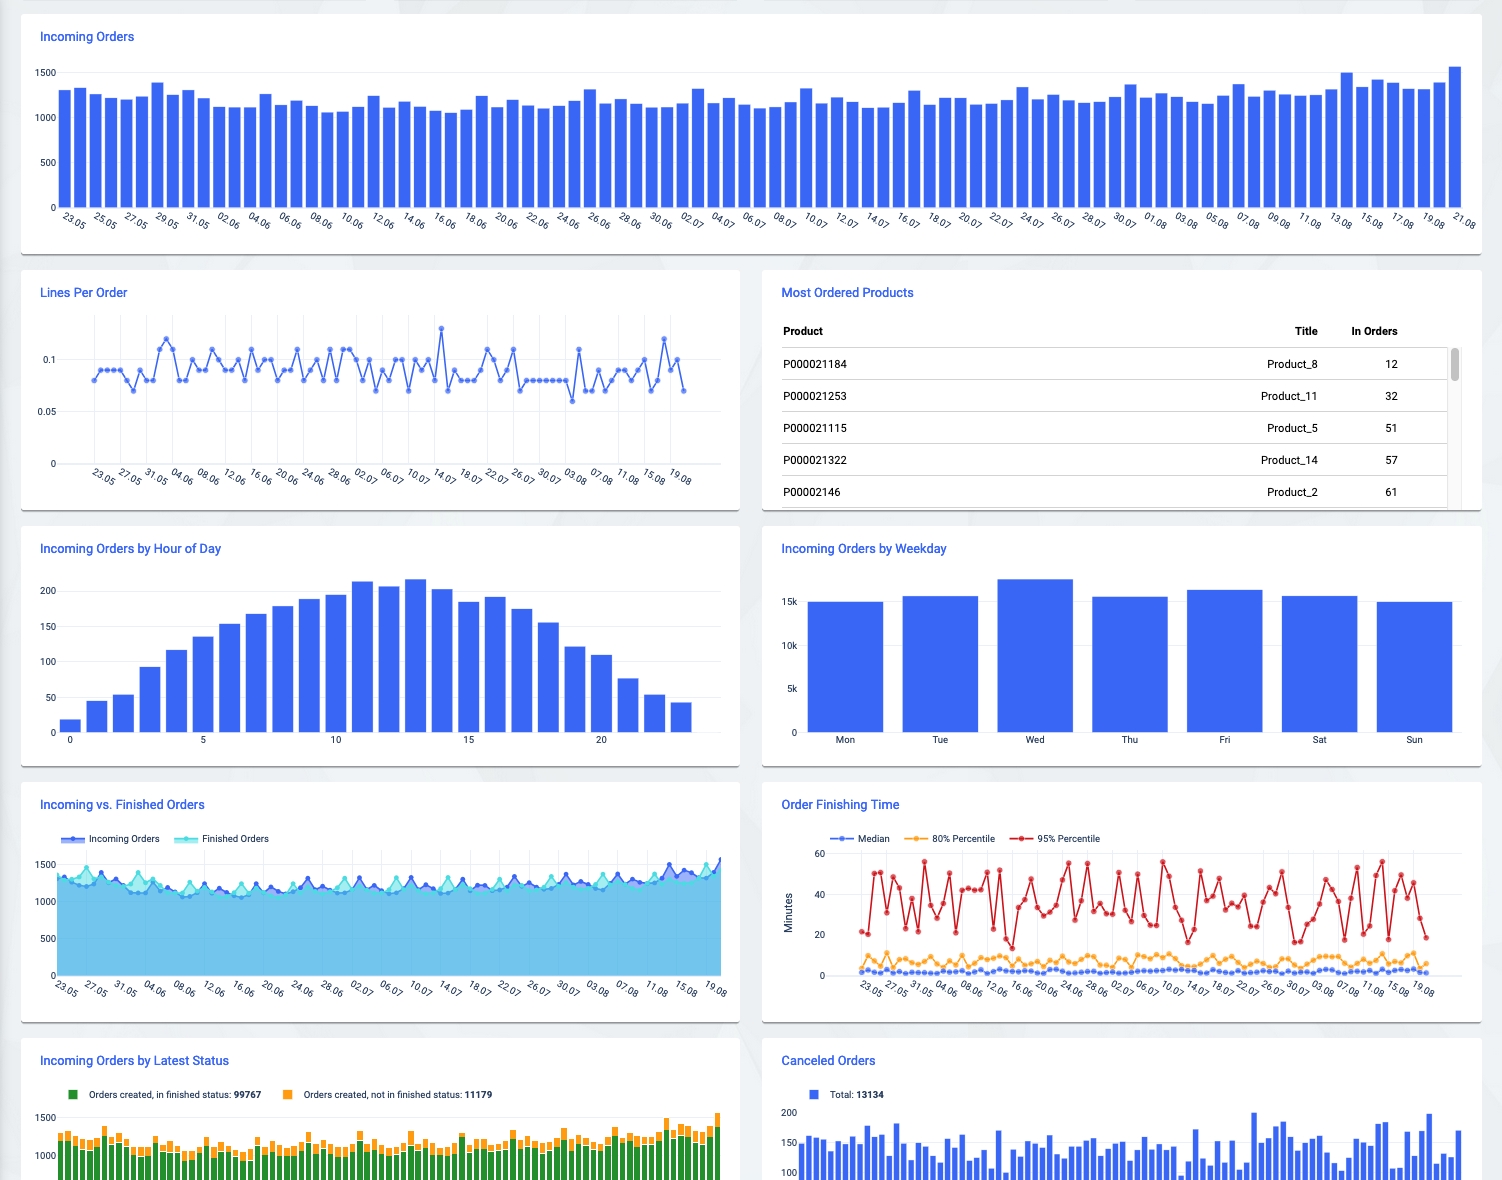
This page contains various data about orders, including order time, status and line items. As this information exists independently of the routing of the orders, there are no references to facilities here.
The number of incoming / created orders is displayed in different ways (total, by date, by time of day, by day of the week). The relevant time used here is the orderDate as set by the upstream system, not the time when the order entity was created in the fulfillmenttools platform.
Orders are considered finished when the status of the underlying process is set to FINISHED. The finishing time is the period of time between creation of the order and the time at which an order is considered finished.
The chart below shows three quantiles of the finishing time by date. This allows you to assess both the typical and the more extreme times. In this example, about 5% of orders that finished on July 16 took more than 51 minutes to finish.
The arithmetic mean is not given here as experience has shown that rare but often unavoidable outliers in process times strongly distort the mean value and lead to incorrect impressions.
Incoming and finished orders are shown here in direct comparison to display, for example, how the order processing is keeping up with the load.
This chart shows the orders by the date they were created, separated by their current status. This helps identifying older orders that have not yet been finished. In this example, 167 of the orders created on August 1st have not been finished yet.
This is the average number of order lines per order for orders that were created within the selected time span or on a specific date. This value is shown both in total and by date
The table lists the products that were present in the most orders created within the selected time span.
This chart shows the number of orders that were canceled per day using the API or the Backoffice.
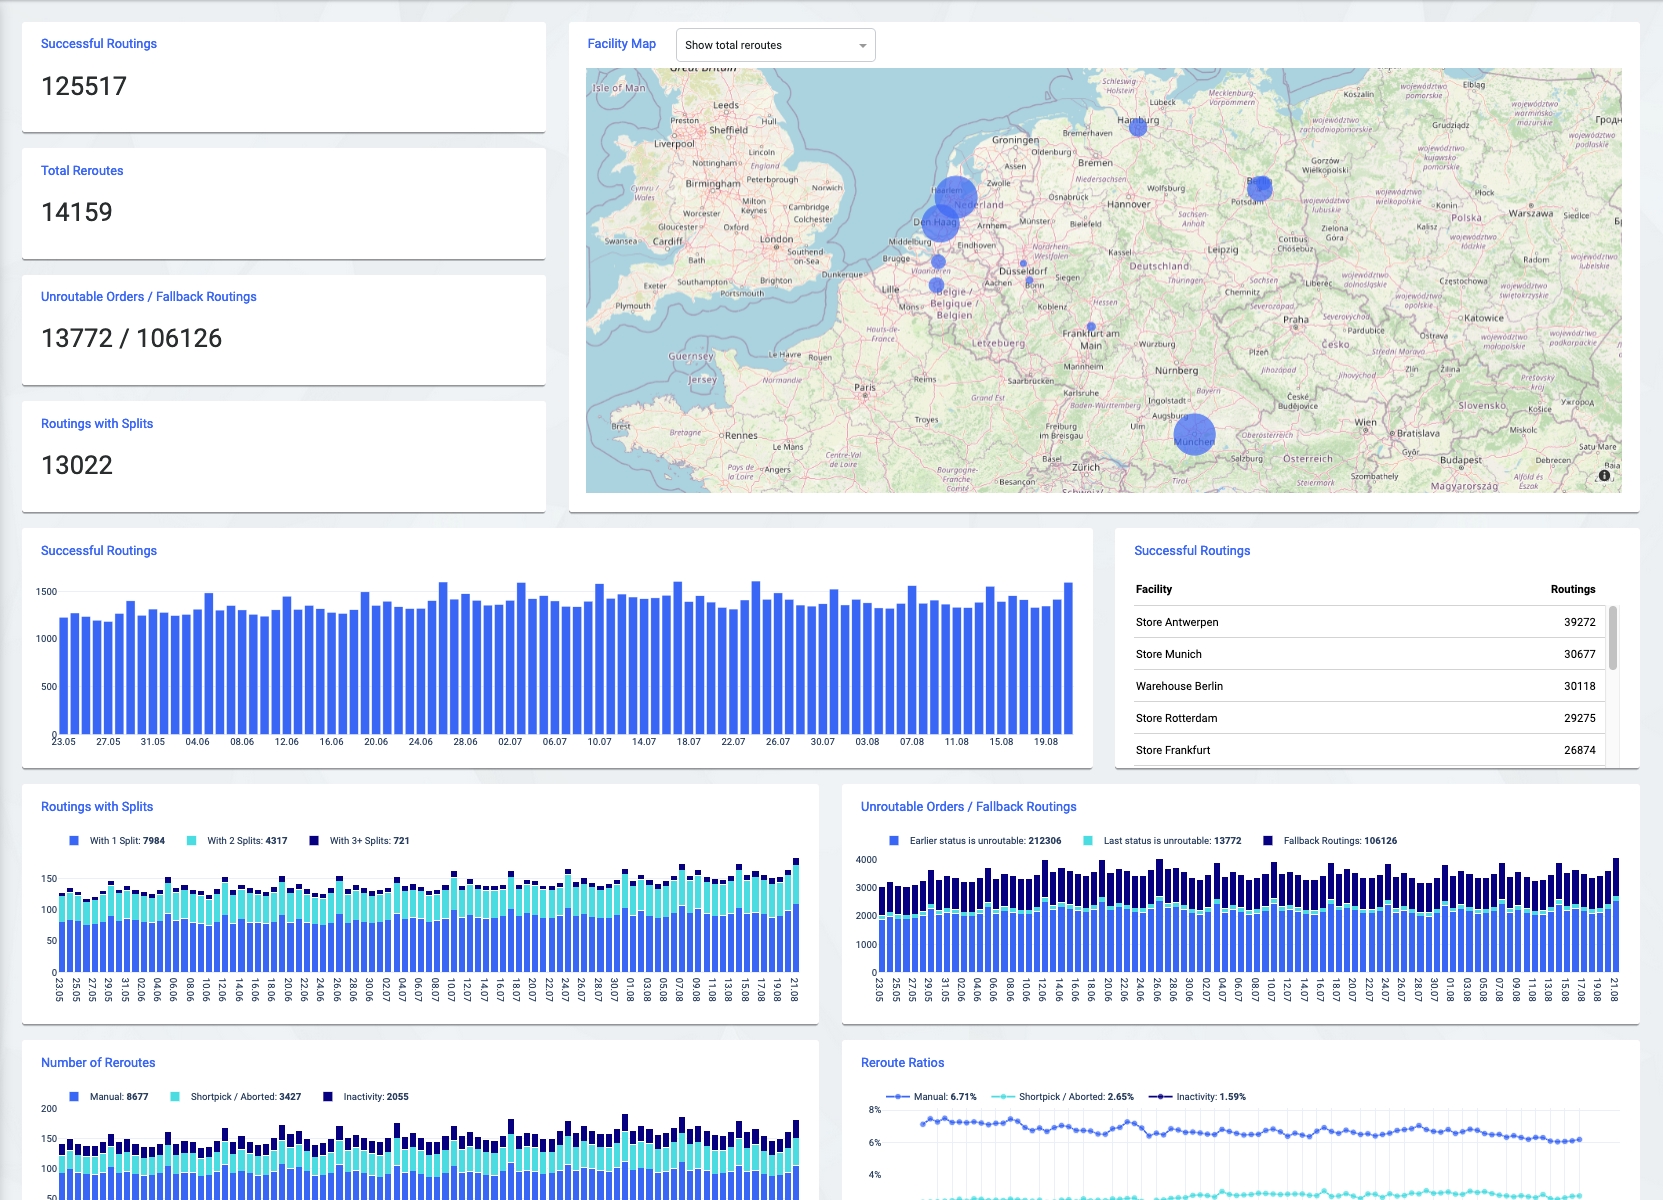
Here you will find routing-related figures and KPIs such as the number of successful routings, re-routes and order splits, displayed both by date and by location. Use the dropdown to also see some of these values as a scatter plot on the map.
A routing is counted as successful if an assignment to a location has taken place. Due to reroutes and order splits, an order can lead to several (successful) routings.
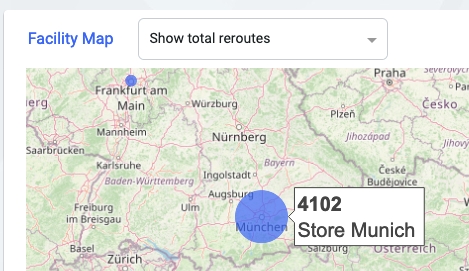
The number of reroutes is listed separately by reason: 'shortpick', 'inactivity' and 'manual'. The facility assigned to a reroute corresponds to the facilty from which is routed away, not the one to which may subsequently be routed. For example, in the picture below 4102 tasks have been removed from the Munich store and routed elsewhere.
If a picking task is aborted and rerouted as a result, this also leads to an entry under 'shortpick'. A manual reroute can occur both when an individual task or the entire order is reassigned manually. Even if an order is automatically routed again after a reset of the entire process, this is counted as a manual reroute.
In addition to the source location, the chart below also shows the target location of reroutes, together with the associated frequency. In this example, 708 tasks were routed from Hamburg to Frankfurt.
If an order split occurs during the reroute, it is not clear which target facility should be displayed. In this case, only the first facility that was used during the routing is counted as the target facility.
An obvious definition of the reroute ratio seems to be "What proportion of my routings were rerouted later?". However, since these events can happen on different days, this KPI cannot be calculated in conjunction with a selected time period.
For this reason, a different definition is used here, which answers the question "What proportion of the finished tasks in a facility ended with a reroute?" More precisely, for the example of manual reroutes:
manual_reroute_ratio = number_of_manual_reroutes / (total_number_of_reroutes + number_of_pickjobs_finishing_any_other_way)
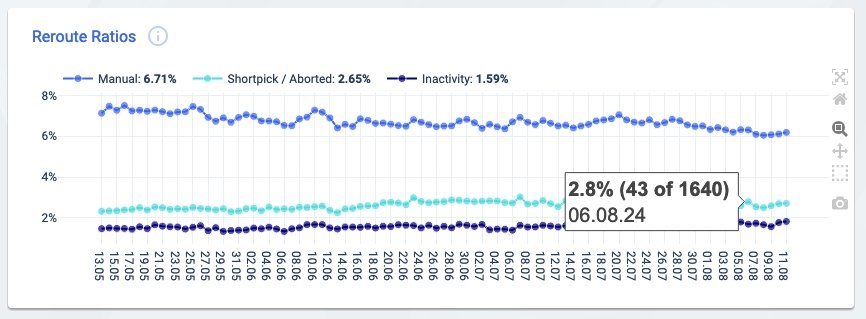
Note that the denominator has two parts, as a reroute can occur before a pick job has been created. In the chart below, 1640 tasks were somehow finished on August 6, 43 of them with a reroute by shortpick. This corresponds to a ratio of 2.8%.
A high reroute ratio alone might not be too alarming if the total number of routings to the location is rather low. For this reason, both values are also plotted against each other in a scatter plot, with each point representing a location. Attention should be paid to data points in the top right-hand corner, as they indicate facilities with both a high number of routings and a high reroute ratio. In the example, this applies to Munich.
Since it makes a difference whether orders were only temporarily or permanently unroutable, this is displayed separately. In the example below, there were about 2000 routings on July 10 that went into the unroutable status, but only 144 remained in it ("Last status is unroutable") while the rest changed their status subsequently to something else ("Earlier status is unroutable").
The occurrence of order splits is shown separately according to how many parts an order is split into. "1 split" means a split into two parts.
In the following graphic, each order leads to a single entry. Here, on August 5, there were 61 routings of orders that led to exactly 2 splits (3 parts). Only routings that have not been rerouted are taken into account. This means that if there was initially a split, but not after a reroute of the entire order, no split is counted for this order.
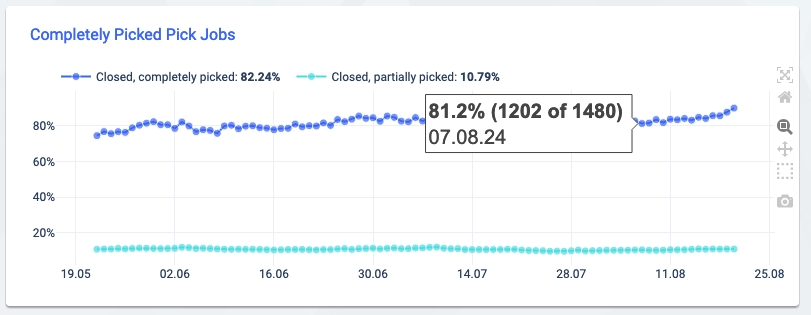
The routing should assign an order to a location where it can be fulfilled in the best possible way. For this reason, the “completely picked pick jobs” indicate the proportion of incoming tasks that lead to successfully closed and fully picked pick job. More precisely, analogous to the calculation of the reroute ratios:
completely_picked_pickjobs(ratio) = closed_and_completely_picked_pick_jobs / (total_number_of_reroutes + number_of_pickjobs_finishing_any_other_way)
In addition, the percentage of successfully closed but only partially picked pick jobs is also shown in the graphic below. In this example, 1202 pick jobs were completely picked on August 7, while 1480 tasks ended in some way overall.
This graph allows you to see what proportion of the orders created are or ship-from-store orders.
Usually, a pick job is also generated in each case. An exception to this are , where a pick job is only created after unlocking.
A definition of these terms can be found . The number of non-routable orders and fallback routings are shown both in total and by date. In the case of order splits or if an order generates several failed / fallback routings, several entries per order can actually arise.
