> For the complete documentation index, see [llms.txt](https://docs.fulfillmenttools.com/documentation/llms.txt). Markdown versions of documentation pages are available by appending `.md` to page URLs; this page is available as [Markdown](https://docs.fulfillmenttools.com/documentation/backoffice/network-view/analytics/inventory-pages.md).
# Inventory analytics
Inventory analytics includes [inbound](#inbound) data. Use the **Explore dashboard** navigation to switch to the corresponding page.
You can filter by time frame and facility. Once selected, click **Apply** to apply the filters.
You can download the data to an Excel file using the **Download** button at the bottom of the page.
## Inbound
The inbound page provides an overview of purchase orders, associated deliveries, and accepted, missing, and rejected items.
At the top of the page, you'll see some top-level inbound figures.
### Purchase order events
{% columns %}
{% column %}
The order events chart shows when purchase orders were placed and whether delivery is expected as soon as possible (ASAP) or on a specific date. The assigned date is the requested date specified when the purchase order was created.
{% endcolumn %}
{% column %}
{% endcolumn %}
{% endcolumns %}
### Delivery events
{% columns %}
{% column %}
A delivery can occur in one complete or several partial deliveries. This chart shows the number of complete and partial deliveries by the received date of the corresponding receipt. As soon as a receipt indicates a partial delivery, fulfillmenttools counts all receipts for the same purchase order as partial deliveries.
For example, the chart on the right shows two deliveries on 28 July: one fully fulfilled the associated purchase order and the other only partially.
{% endcolumn %}
{% column %}
{% endcolumn %}
{% endcolumns %}
### Rejected and missing quantities
The delivery receipts list the quantities of accepted and rejected items. fulfillmenttools then calculates the number of missing items using this calculation:
`missing = ordered - accepted - rejected >= 0`
If a delivery is made in several parts, fulfillmenttools assigns the missing quantity to the date of the first partial delivery receipt.
{% columns %}
{% column %}
The first chart shows the rejected and missing quantities by item. It separates rejected and missing quantities. If everything was accepted from a purchase order, the chart shows 0.
For example, for deliveries on 19 August, 9 items were rejected, and 19 items were missing.
The data is also shown in a table view so you can see the items that are most often rejected or missing.
{% endcolumn %}
{% column %}
{% endcolumn %}
{% endcolumns %}
{% columns %}
{% column %}
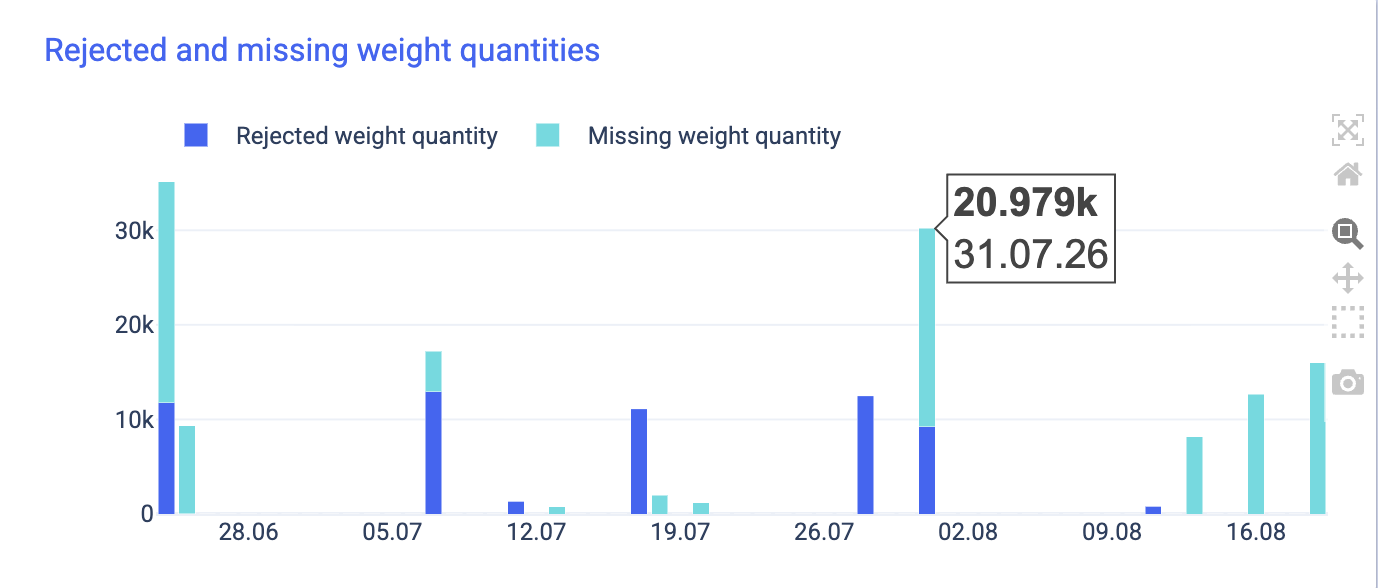
The second chart shows the rejected and missing quantities by unit of weight. This includes only items measured by weight. It separates rejected and missing weight quantities. If everything was accepted from a purchase order, the chart shows 0.
For example, for deliveries on 31 July, the weight of rejected items was 9.217 kilos, and the weight of missing items was 20.979 kilos.
The data is also shown in a table view so you can see the items that are most often rejected or missing.
{% endcolumn %}
{% column %}
{% endcolumn %}
{% endcolumns %}
---
# Agent Instructions
This documentation is published with GitBook. GitBook is the documentation platform designed so that both humans and AI agents can read, navigate, and reason over technical content effectively. Learn more at gitbook.com.
## Querying This Documentation
If you need additional information that is not directly available in this page, you can query the documentation by asking a question.
Perform an HTTP GET request on the following URL with the `ask` and `goal` query parameters:
```
GET https://docs.fulfillmenttools.com/documentation/backoffice/network-view/analytics/inventory-pages.md?ask=&goal=
```
`ask` is the immediate question: it should be specific, self-contained, and written in natural language.
`goal` is what the user is ultimately trying to achieve, the reason they need the answer. Sharing it helps GitBook give you a better, more relevant answer. A goal is most helpful when it describes the outcome the user wants rather than restating the question. For example, with `ask=how do I create an API token`, a goal like `automate deployments from our CI pipeline` lets GitBook tailor the answer to that use case.
The response will contain a direct answer to the question and relevant excerpts and sources from the documentation.
Use this mechanism when the answer is not explicitly present in the current page, you need clarification or additional context, or you want to retrieve related documentation sections.