> For the complete documentation index, see [llms.txt](https://docs.fulfillmenttools.com/documentation/llms.txt). Markdown versions of documentation pages are available by appending `.md` to page URLs; this page is available as [Markdown](https://docs.fulfillmenttools.com/documentation/backoffice/network-view/analytics/doms-pages.md).
# Order management analytics
Order management analytics includes [order](#orders) and [routing](#routing) data. Use the **Explore dashboard** navigation to switch to the corresponding page.
You can filter by time frame and select the time granularity (daily, weekly, or monthly). You can also filter by facility for routing only. Once selected, click **Apply** to apply the filters.
You can download the data to an Excel file using the **Download** button at the bottom of both pages.
## Orders
The **Orders** analytics page contains various order data, including order time, status, and line items. As this information exists independently of the routing of the orders, there are no references to facilities here.
At the top of the page, you'll see some top-level order figures.
### Incoming orders
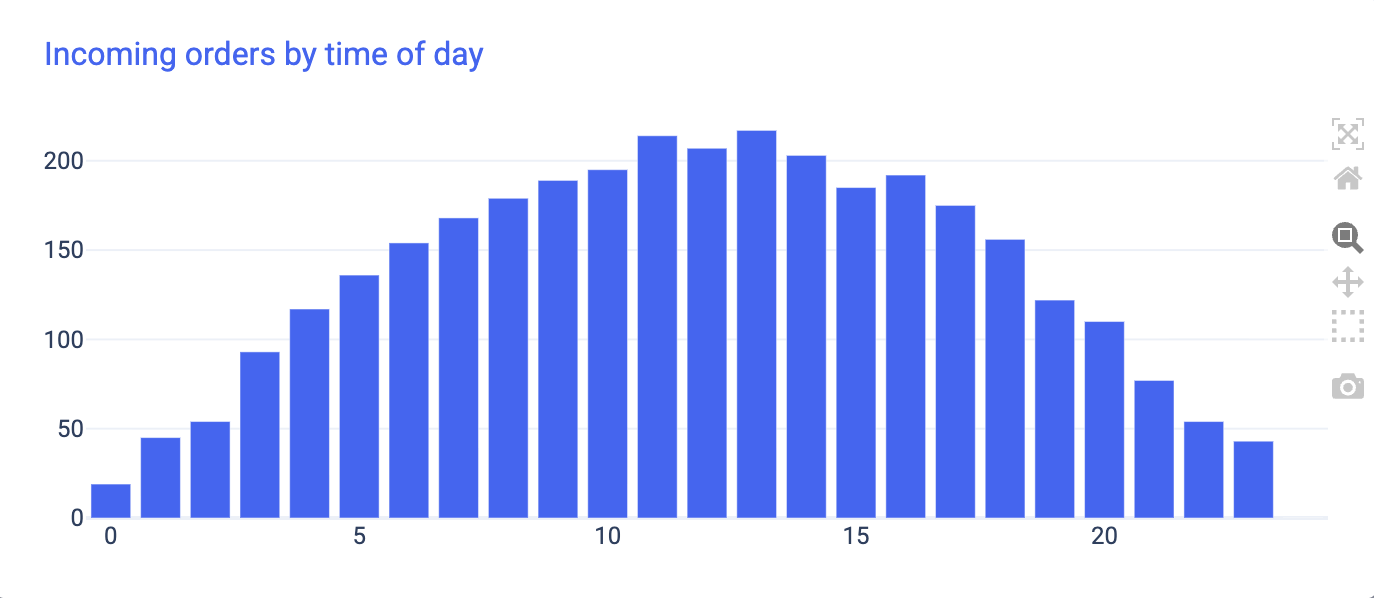
The number of incoming or created orders is displayed in different ways (total, by date, by time of day, by day of the week). The order date set by the upstream system is used, not the time the order entity was created in fulfillmenttools.
{% columns %}
{% column %}
{% endcolumn %}
{% column %}
{% endcolumn %}
{% endcolumns %}
### Lines per order
{% columns %}
{% column %}
The lines per order chart shows the average number of order lines per order for orders that were created within the selected time span or on a specific date. This value is shown both in total and by date.
{% endcolumn %}
{% column %}
{% endcolumn %}
{% endcolumns %}
### Most ordered items
{% columns %}
{% column %}
The table lists the items that were present in the most orders created within the selected time span.
It shows the article ID, article name, and how many orders it was in.
{% endcolumn %}
{% column %}
{% endcolumn %}
{% endcolumns %}
### Finished orders and order finishing time
Orders are considered finished when the underlying process status is set to finished. Finishing time is the period between order creation and the time the order is considered finished.
The chart below shows three quantiles of the finishing time by date. This allows you to assess both typical and extreme times. In this example, about 5% of orders that finished on 24 July took more than 51 minutes.
{% hint style="info" %}
The arithmetic mean isn't used because rare but often unavoidable outliers in process times strongly distort the mean value and lead to incorrect impressions.
{% endhint %}
{% columns %}
{% column %}
Incoming and finished orders are also shown in direct comparison to display how order processing correlates with the incoming order volume.
{% endcolumn %}
{% column %}
{% endcolumn %}
{% endcolumns %}
{% columns %}
{% column %}
The incoming orders by latest status chart shows orders by creation date, separated by current status. This helps identify older orders that aren't finished yet. In this example, 167 orders created on 9 August are not yet finished.
{% endcolumn %}
{% column %}
{% endcolumn %}
{% endcolumns %}
### Canceled orders
{% columns %}
{% column %}
The canceled orders chart shows the number of orders canceled per day via the [REST API for order actions](https://fulfillmenttools.github.io/fulfillmenttools-api-reference-ui/#post-/api/orders/-orderId-/actions) or Backoffice.
{% endcolumn %}
{% column %}
{% endcolumn %}
{% endcolumns %}
### Orders by service type
{% columns %}
{% column %}
The orders by service type chart shows the proportion of created orders that are [click-and-collect orders](/documentation/by-pillar/order-management.md#click-and-collect-order) or [ship-from-store orders](/documentation/by-pillar/order-management.md#ship-from-store-order).
{% endcolumn %}
{% column %}
{% endcolumn %}
{% endcolumns %}
## Routing
The **Routing** analytics page shows routing-related figures and key performance indicators (KPIs), such as the number of successful routings, reroutes, and order splits, displayed by date and location. The dropdown menu on the map lets you view some of these values as a scatter plot.
### Successful routings
{% columns %}
{% column %}
A routing is counted as successful if an assignment to a location has taken place. Due to [reroutes](#reroutes) and [order splits](#order-splits), an order can lead to several (successful) routings.
Usually, a pick job is also generated in each case. An exception to this is [locked orders](/documentation/by-pillar/order-management.md#order-statuses), where a pick job is only created after unlocking.
{% endcolumn %}
{% column %}
{% endcolumn %}
{% endcolumns %}
### Reroutes
{% columns %}
{% column %}
You can view reroute data in multiple ways.
Firstly, you can use the map dropdown to show the total number of reroutes from which facility it was routed away from. For example, in the chart on the right, 4102 tasks have been removed from the Munich store and routed elsewhere.
{% endcolumn %}
{% column %}
{% endcolumn %}
{% endcolumns %}
{% columns %}
{% column %}
You can also see the number of reroutes split by reason. These can be [manual](/documentation/by-pillar/advanced-order-routing/reroute.md#rerouting-reroutetaskmanually), [short pick](/documentation/by-pillar/advanced-order-routing/reroute.md#rerouting-routingincaseofshortpick), and [inactivity](/documentation/by-pillar/advanced-order-routing/reroute.md#rerouting-rerouteincaseofinactivity-time-triggeredreroute). If a picking task is aborted and rerouted as a result, this is also counted under a short pick.
A manual reroute can occur when an individual task or the entire order is reassigned manually. Even if an order is automatically routed again after resetting the entire process, this is counted as a manual reroute.
{% endcolumn %}
{% column %}
{% endcolumn %}
{% endcolumns %}
{% columns %}
{% column %}
In addition to the source location, the chart below also shows the target location of reroutes, together with the associated frequency. In this example, 708 tasks were rerouted from Hamburg to Frankfurt.
You can also view this as a list.
If an order split occurs during the reroute, it's not clear which target facility to display. In this case, only the first facility used during routing is counted as the target facility.
{% endcolumn %}
{% column %}
{% endcolumn %}
{% endcolumns %}
#### Reroute ratios
A common question is what proportion of routings are later rerouted. However, since these events can happen on different days, this KPI can't be calculated against a selected time period.
For this reason, we use a different definition: the proportion of finished tasks in a facility that ended with a reroute. For example, the manual reroute ratio is calculated as follows:
```
manual_reroute_ratio = number_of_manual_reroutes / (total_number_of_reroutes + number_of_pickjobs_finishing_any_other_way)
```
The denominator has two parts because a reroute can occur before a pick job is created. In the chart below, 1538 tasks were finished in some way on 11 August, 43 of them with a reroute by short pick. This corresponds to a ratio of 2.8%.
{% columns %}
{% column %}
A high reroute ratio is less significant if the total number of routings to the location is low. For this reason, we also plot both values against each other in a scatter plot, with each point representing a location. Data points in the top right-hand corner require attention, as they indicate facilities with both a high number of routings and a high reroute ratio. In the example on the right, this applies to Munich.
In the list view, you can see this is mainly due to manual reroutes and time-triggered reroutes.
{% endcolumn %}
{% column %}
{% endcolumn %}
{% endcolumns %}
### Unroutable orders and fallback routings
{% columns %}
{% column %}
The number of [unroutable orders](/documentation/by-pillar/advanced-order-routing/unroutable-orders.md) and [fallback routings](/documentation/by-pillar/advanced-order-routing/unroutable-orders.md#using-a-fallback-facility) is shown both in total and by date. If an order is split or generates several failed or fallback routings, it can create multiple entries per order.
Because it matters whether orders were temporarily or permanently unroutable, this is displayed separately. In the example below, about 2000 routings on July 10 went into unroutable status, but only 144 remained there ("Last status is unroutable"), while the rest later changed to something else ("Earlier status is unroutable").
{% endcolumn %}
{% column %}
{% endcolumn %}
{% endcolumns %}
### Order splits
{% columns %}
{% column %}
Order splits are shown separately by how many parts an order is split into. 1 split means a split into two parts.
In the following chart, each order leads to a single entry. On August 5, 61 order routings led to exactly 2 splits (3 parts). We only count routings that have not been rerouted. This means that if there was initially a split, but not after a reroute of the entire order, no split is counted for this order.
{% endcolumn %}
{% column %}
{% endcolumn %}
{% endcolumns %}
### Completely picked pick jobs
{% columns %}
{% column %}
The Completely picked pick jobs table indicates the proportion of incoming tasks that result in a successfully closed, fully picked pick job. This is split by facility.
You can also see the percentage of successfully closed pick jobs as well as closed partially picked pick jobs. In this example, 1202 pick jobs were completely picked on 3 August, while 1480 tasks ended in some way overall.
{% endcolumn %}
{% column %}
{% endcolumn %}
{% endcolumns %}
The completely picked pick job ratio is calculated by:
```
completely_picked_pickjobs(ratio) = closed_and_completely_picked_pick_jobs / (total_number_of_reroutes + number_of_pickjobs_finishing_any_other_way)
```
---
# Agent Instructions
This documentation is published with GitBook. GitBook is the documentation platform designed so that both humans and AI agents can read, navigate, and reason over technical content effectively. Learn more at gitbook.com.
## Querying This Documentation
If you need additional information that is not directly available in this page, you can query the documentation by asking a question.
Perform an HTTP GET request on the following URL with the `ask` and `goal` query parameters:
```
GET https://docs.fulfillmenttools.com/documentation/backoffice/network-view/analytics/doms-pages.md?ask=&goal=
```
`ask` is the immediate question: it should be specific, self-contained, and written in natural language.
`goal` is what the user is ultimately trying to achieve, the reason they need the answer. Sharing it helps GitBook give you a better, more relevant answer. A goal is most helpful when it describes the outcome the user wants rather than restating the question. For example, with `ask=how do I create an API token`, a goal like `automate deployments from our CI pipeline` lets GitBook tailor the answer to that use case.
The response will contain a direct answer to the question and relevant excerpts and sources from the documentation.
Use this mechanism when the answer is not explicitly present in the current page, you need clarification or additional context, or you want to retrieve related documentation sections.